English
 Español
 Русский
 لالعربية
Blend Uniformity Testing: Measure CV% in Powder Mixing
release time:
2026-09-15
Learn how to test blend uniformity in powder mixing: sampling plans, CV% calculation, industry acceptance criteria and how mixer design affects homogeneity.
Blend uniformity is the only objective proof that a powder mixing process actually works. A mixer can run smoothly, draw full power and look convincingly active, and still produce a batch that fails assay — because visual motion says nothing about how evenly an active ingredient is distributed. This guide covers how to sample a blend correctly, how to calculate CV%, what acceptance criteria are realistic by industry, and how mixer design changes the outcome.
What blend uniformity actually measures
The standard metric is the coefficient of variation, written CV% and often reported as relative standard deviation (RSD). It compares the spread of measured values across samples with their average:
CV% = (standard deviation ÷ mean) × 100
A low CV% means every sample contained a similar concentration of the target component — not that the powder “looks mixed”. Two consequences follow:
The result is only as trustworthy as the samples. Bad sampling produces a high CV% on a perfectly good blend.
The test needs a quantified analyte: an assay of the active ingredient, or a tracer deliberately added for the trial.
For free-flowing powders, a coloured tracer gives a fast visual read. For regulated products, assay testing of the active ingredient is the accepted method.
How to take samples that mean something
Sample count and locations
A single sample says nothing about a 2,000-litre batch. Common practice is a minimum of ten sampling points, distributed so they cover the whole vessel rather than one convenient corner.
Sample along the full length or diameter, not only near the discharge valve.
Include the places where segregation is most likely: the top surface, the region near the walls, and any area above a dead zone.
In a conical or vertical mixer, sample at several heights.
Take more samples on the first validation batch than you intend to take in routine production.
Tools and timing
A thief sampler or side-entry probe extracts a core sample at a defined depth. A scoop taken from the top layer flatters the result, because it reads only the surface — the layer most exposed to sifting and dust loss. Sample while the batch is at rest after the intended mixing time, and keep the sampling action itself consistent between batches, otherwise you are measuring your technique as much as your mixer.
One more control: never mix, then walk away for ten minutes before sampling. Free-flowing powders keep segregating when they are left still. Sample immediately after the mixer stops.
Calculating CV% step by step
Use the sample standard deviation with n − 1 in the denominator, then divide by the mean. The table below works through a ten-point assay result on a 500 kg ribbon blender batch.
| Sample | Assay (% of label claim) | Deviation from mean |
|---|---|---|
| 1 | 98.5 | −1.5 |
| 2 | 101.2 | +1.2 |
| 3 | 99.4 | −0.6 |
| 4 | 100.1 | +0.1 |
| 5 | 97.8 | −2.2 |
| 6 | 102.3 | +2.3 |
| 7 | 99.9 | −0.1 |
| 8 | 100.6 | +0.6 |
| 9 | 98.9 | −1.1 |
| 10 | 101.3 | +1.3 |
Mean = 100.0%. Sum of squared deviations = 17.46. With ten samples, the sample variance is 17.46 ÷ 9 = 1.94, so the standard deviation is 1.39. CV% = 1.39 ÷ 100.0 × 100 = 1.4%.
That result would pass almost any specification. Note what the raw numbers also show: the spread runs from 97.8 to 102.3, a 4.5-point range. Mean and CV alone hide that, so always report the minimum and maximum alongside them.
Acceptance criteria by industry
There is no single universal number, but published practice and customer specifications cluster around the values below. Treat them as a starting point for negotiation, not as a substitute for your own product specification.
| Industry | Typical CV% target | Practical notes |
|---|---|---|
| Pharmaceutical solid dosage | ≤ 5% | Stratified sampling, assay of active; tighter limits for low-dose products |
| Nutraceutical and supplements | ≤ 5% | Vitamins and minerals often dosed below 1%, which raises difficulty |
| Food and infant formula | ≤ 5% | Critical micro-ingredients treated like pharmaceutical actives |
| Animal feed and premix | ≤ 5–10% | Premix dilution stages carry the strictest requirement in the chain |
| Chemical and specialty | ≤ 5–10% | Driven largely by the customer specification and downstream reaction |
| Dry mortar and building materials | ≤ 10% | Colour and additive consistency matter more than close assay control |
Set the limit before running the test. Choosing a target after seeing the numbers is the fastest way to lose an argument with a customer or an auditor.
Which variables actually move CV%
Loading ratio. Most mixers work best between roughly 40% and 70% of total vessel volume. Filling above the design limit removes the freeboard the powder needs to circulate, and CV% rises even though the mixer is “fuller”.
Mixing time. Uniformity improves, plateaus, then can deteriorate. Beyond the optimum, free-flowing powders with different particle sizes begin to demix — the mixer starts separating what it just blended.
Shaft speed. Higher speed is not automatically better. Past a threshold, light fine particles are thrown into the air and drop out by size, which increases segregation.
Particle size and bulk density difference. This is the dominant material factor. A significant density gap between components is the single most common reason a blend will not hold uniformity.
Moisture, static and agglomerates. Damp or charged powders form lumps, and a lump carries a concentration that no amount of mixing time will break up.
Micro-ingredient dosage. Components below roughly 1% of batch weight are hard to disperse directly. Pre-blending with a carrier, or a mixer with genuine fluidising action, is usually necessary.
How mixer design changes uniformity
Every industrial mixer blends through some combination of three mechanisms: convection, where large groups of particles are moved bodily; diffusion, where individual particles migrate through the bed; and shear, which breaks down agglomerates. The mix of those three decides which materials a machine suits.
Ribbon and paddle mixers
Counter-rotating ribbon or paddle elements lift material at the outer edge and return it along the centre, creating strong convection with low shear. This is the workhorse choice for general dry powders at medium to large batch sizes. A well-set ribbon unit typically reaches 3–5% CV in three to eight minutes. See the DLH Small Ribbon Mixer for a compact configuration, or the broader DPH Paddle Ribbon Mixer for heavier duty.
Double-shaft paddle mixers
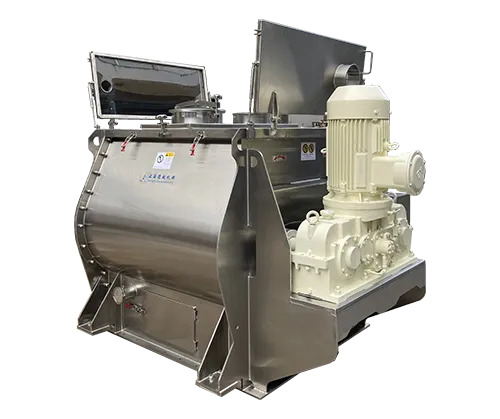
Two shafts turning in opposite directions generate a fluidised zone along the centre of the trough. Mixing is fast — often 30 to 60 seconds to reach uniformity — and the fluidised action handles liquid additions and low-dose components better than a ribbon. The DJH Double-Shaft Paddle Mixer covers batch operation; where throughput is the constraint, the DJHX Continuous Twin-Shaft Paddle Mixer applies the same geometry continuously.
Conical screw mixers
A rotating screw orbiting the inner wall lifts material from the bottom and releases it at the top, producing gentle three-dimensional convection with very low shear. Because there is no high-speed element, conical screw mixers suit friable, heat-sensitive and very fine powders, and they resist the size-based segregation that high-speed machines can trigger. The DSHL Conical Screw Mixer is normally the right answer when a ribbon or paddle machine keeps losing uniformity on density-different components.
Laboratory and gravity mixers
Uniformity work starts small. A laboratory mixer lets you establish the achievable CV% and the optimum mixing time on a few litres before committing to production scale, and it makes formulation changes cheap to test. The DEH Laboratory High-Efficiency Mixer is sized for exactly this. Where the product is fragile, or where complete discharge and cleaning between batches dominates the decision, gravity-driven tumble designs are often the better route.
A practical verification protocol
Write the specification first: target CV%, the analyte to be measured, the analytical method, and the sample count.
Define the sampling map on a drawing of the vessel, so locations are reproducible between batches.
Run the batch at the intended loading ratio and shaft speed, and stop at the planned mixing time.
Sample immediately, using the same tool and technique at every location.
Analyse and calculate CV%, and report the minimum, maximum and mean alongside it.
Repeat across at least three consecutive batches. A single good batch proves nothing about a process.
Record the validated mixing time, loading ratio and speed, and make them the production standard.
When to change the machine instead of the recipe
Process optimisation has limits. If CV% stays above target after you have corrected the loading ratio, swept the mixing time properly and allowed for the sampling error, the problem is the mixing mechanism, not the settings. The usual diagnoses are consistent: components with a real density difference that no amount of tumbling will hold together; a low-dose active that needs fluidising rather than gentle convection; a friable product that a high-shear element is damaging; or a cleaning and cross-contamination requirement that internal elements make expensive to satisfy.
Those are equipment decisions. Matching the mixing mechanism to the material is cheaper than fighting a mismatch with cycle time for years.
Deyue Machinery designs and manufactures ribbon, paddle, conical screw, ploughshare and vacuum mixing equipment for powder and paste processing. If you are setting a uniformity specification, or trying to rescue a blend that will not hold CV%, send us your material data and batch target — our engineers will recommend the mixing mechanism that fits, and can verify it on laboratory equipment before you commit to a production machine.
label:
related news